EDHEC Cross-Model Climate Institute Temperature Emulator and EDHEC-Climate-Induced Regional Macroimpacts Projector


Photo credit: EDHEC Climate Institute
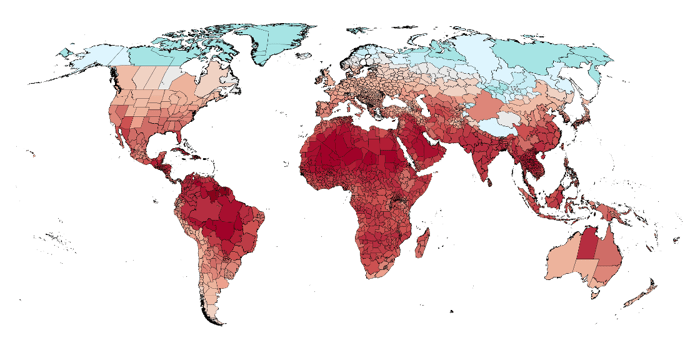
EDHEC-CLIRMAP - Interactive Map
The EDHEC Climate Institute is releasing two new interactive visualisations that combine scientific rigour with accessibility, enabling users ― including scientists, policymakers, financial professionals, and the broader public to explore future climate and emissions pathways, and their projected economic impacts.
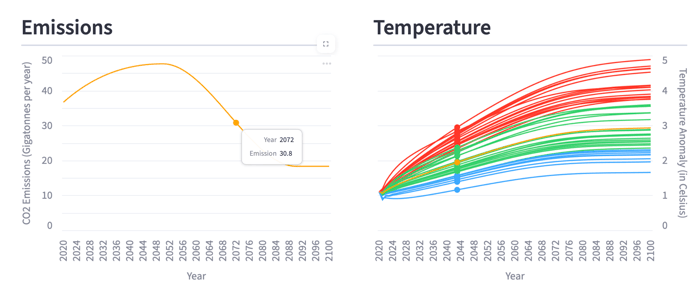
EXCITE Emulator: EDHEC Cross-Model Climate Institute Temperature Emulator
EXCITE enables users to simulate possible global surface temperature outcomes under a wide range of greenhouse gas emissions scenarios, including IPCC AR6 and NGFS scenarios. It offers the ability to:
- Explore the outcomes of established or custom-built emissions pathways;
- Adjust emissions parameters directly or define a social cost of carbon;
- Visualise temperature projections from leading climate models (CMIP5 and CMIP6), grouped into "hot", "core", and "cold" categories.

EDHEC-CLIRMAP: EDHEC-Climate-Induced Regional Macroimpacts Projector
EDHEC-CLIRMAP is a web-based platform that projects the regional economic impacts of mean temperature changes (i.e., the chronic component of physical climate risks) on Gross Regional Product (GRP) per capita. Drawing on the latest economic and climate historical records, alongside time and spatially-resolved climate change simulations from NASA, the tool allows users to:
- Visualise projections of future economic damages under different warming scenarios;
- Configure key parameters―including global climate models, SSP-RCP pathways, and time horizons―to tailor the investigation;
- Uncover the heterogeneity story behind the geography of physical risk impacts―central to improving adaptation strategies.
These tools are designed to support researchers, policymakers, investors, and other stakeholders in making informed decisions about climate-related risks and opportunities, and they can also serve as powerful pedagogical tools for teaching and raising awareness about climate issues.
Both visualisations are accompanied by comprehensive documentation, including scientific background papers and practical how-to guides, to support users in understanding the methodology and making the most of these tools.
Published by
 investESG
 investESG

