INSIGHT by Sebastian Müller, LL.M., is co-founder, in-house lawyer and head of law & regulation at right. based on science


© Farideh Fotografie
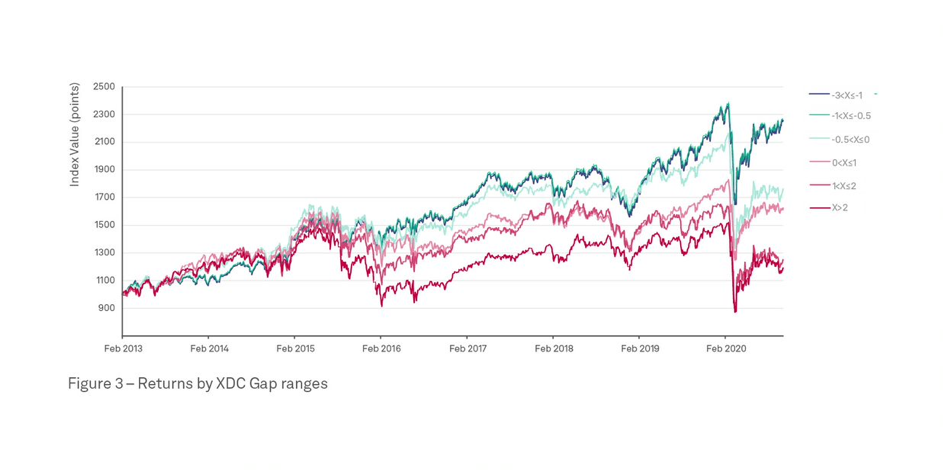
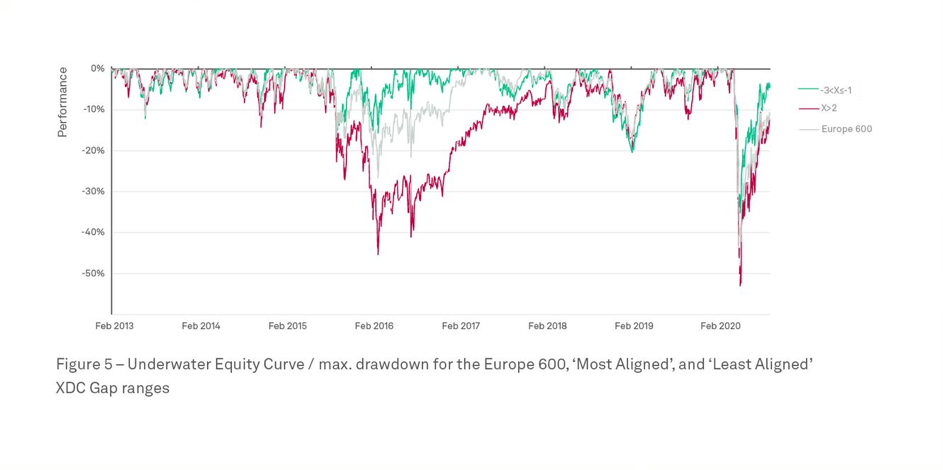
Why Temperature AlignmentFor years, investors have been struggling to find suitable approaches to integrate sustainability in a reliable, transparent and uniform way into their investment process. This was also accelerated through the EU Climate Disclosure Regulation1 and the EU Taxonomy2. Until recently, the focus was on the impact of climate change on investments, the so-called 'outside-in' perspective.However, in mid-2019, the EU Commission felt compelled to clarify the concept of materiality. This had long been intended, following the CSR Directive3, however interpretations of the phrase "significant risks relating to environmental issues" differed widely. Now, the concept of Double Materiality, has been clearly defined by policy makers: complementary to the outside-in perspective, the inside-out perspective describes the influence of a company on the climate, which can be financially material and therefore also has to be reported.Partially in response to this, the idea of so-called "temperature alignment"4 is gaining momentum, mainly fuelled by the financial sector. Temperature Alignment is the concept of calculating the compatibility of investments and economic activities with a certain temperature or global warming scenario.In order to support financial institutions, investment companies and institutional investors in choosing a temperature alignment methodology, the UN-convened Net-Zero Asset Owner Alliance (NZAOA) - an association of over 30 international asset owners and institutional investors with a total of USD 5.1 trillion in assets under management - issued a catalogue of requirements in mid-2020. They are divided into core principles, technical requirements and aspects which, in the opinion of the NZAOA, should be taken into account with regard to the suitability of temperature alignment metrics for portfolio valuation and portfolio management.According to the NZAOA criteria, the climate impact of a portfolio is not the same as the emissions it finances. Greenhouse gases should form the basis of temperature alignment calculations and it should be possible to determine the conformity of portfolios and individual securities with the Paris Climate Agreement based on scientifically recognised emission reduction paths towards a 1.5 °C temperature target. Risk and ReturnWhile fully recognising and supporting the urgently needed transition towards climate neutrality and the 1.5 °C target, asset managers and investors must, of course, be guided by capital preservation and generating returns. For many years, there has been a controversial discussion among experts about how ESG, sustainability and climate criteria affect the risk/return ratio of investments. In that sense, to be suitable to investment uses, temperature alignment metrics must also take financial and economic performance into account.An analysis published in October 20205 of a total of 856 European shares (the investment universe of the Solactive Europe 600 Index, hereinafter “Europe 600”) for the period 2013-2020 showed a strong correlation between Temperature Alignment, assessed with the X-Degree Compatibility (XDC) Model, and financial performance:In the historical analysis over the seven-year period, it was initially shown that those shares from the Europe 600 that were compatible with a global warming scenario of a maximum of 2˚C achieved a higher total return at a lower volatility, than the securities that were not 2˚C-aligned. In a second step, the 2˚C-aligned and the 'non-aligned’ stock selection were each divided into three subgroups according to the degree of their alignment, ranging from "Most Aligned" to "Least Aligned".[caption id="attachment_4850" align="aligncenter" width="792"] > zoom image Share price development Solactive Europe 600 Index divided into six share selections according to XDC gap. Source: right. based on science (2020) Capturing the °Climate Factor. Linking Temperature Alignment and Financial Performance through the X-Degree Compatibility (XDC) Model.[/caption] Separate back-tests conducted for each of these stock selections revealed only slight differences in performance in the middle ranges. The four "outer" selections, however, showed considerable differences: The stronger the 2˚C-Alignment, the better the results in terms of return, volatility, maximum drawdown, resilience, Sharpe and Sortino ratio. Within the period under review, the selection of the "Most Aligned" stocks had yielded a 107% higher total return compared to the "Least Aligned" selection, with volatility aligned with the overall volatility of the Europe 600 (16.6%).The risk-adjusted returns also support these results. As the historical "underwater equity curve" shows, the "Most Aligned" selection proved to be more resilient overall compared to the "Least Aligned" subgroup. The maximum drawdown of -30. 6% (tail risk; extreme losses) for the "Most Aligned" selection is significantly smaller than that of the "Least Aligned" subgroup with -42. 6%.[caption id="attachment_4859" align="aligncenter" width="685"]
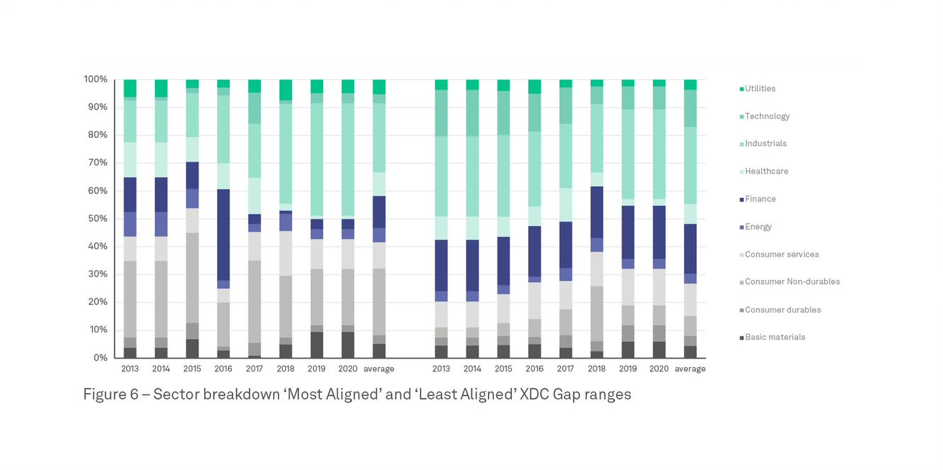
 > zoom image | Underwater Equity Curve of the 'Most Aligned' and 'Least Aligned' stock selection of the Solactive Europe 600 Index in comparison. Source: right. based on science (2020) Capturing the °Climate Factor. Linking Temperature Alignment and Financial Performance through the X-Degree Compatibility (XDC) Model.[/caption] As the XDC Model benchmarks each security against a sector-specific target, that is to say, a Paris-aligned temperature target that is specific to the sector, sector-bias within the stock selections could be avoided. No significant over- or underweighting of sectors was noticeable across the sub-groups.[caption id="attachment_4862" align="aligncenter" width="943"]
 > zoom image | Sector distribution of the 'Most Aligned' and 'Least Aligned' stock selection of the Solactive Europe 600 Index in comparison. Source: right. based on science (2020) Capturing the °Climate Factor. Linking Temperature Alignment and Financial Performance through the X-Degree Compatibility (XDC) Model.[/caption] Temperature Alignment: Benefits for Asset ManagersAlthough the analysis presented is limited in terms of observation period, asset class and region, it provides first indications that temperature alignment metrics such as the XDC Model can bring significant benefits for use in asset management.A solid temperature alignment analysis provides concrete and transparent information on the inside-out materiality perspective, which can also serve as a uniform, unifying and - above all - science-based 'language' for investors, companies, regulators, politicians, and society. To manage a successful transition into a future ‘well below 2˚C’, decision-makers need a strong narrative, which promotes the ability to act instead of paralysing through complexity. When it comes to climate change, there can hardly be a clearer and stronger narrative than temperature. | brief bioDr. Sebastian Müller, LL.M., is co-founder, in-house lawyer and head of law & regulation at right. based on science. After his doctorate in tax law, he worked for several years for the international law firm CMS Hasche Sigle in Frankfurt. At right. he is responsible for the legal foundation of the XDC Model and the cooperation with financial market actors. aboutright. based on science GmbH (right.) is a provider of climate metrics and software. Founded in Frankfurt in 2016, right. developed the X-Degree Compatibility (XDC) Model to calculate the impact a company, a portfolio or any other economic entity has on global warming (Temperature Alignment). The results are expressed as a tangible degree Celsius value Endnotes
1 Regulation (EU) 2019/2088 of the European Parliament and of the Council of 27 November 2019 on sustainability‐related disclosures in the financial services sector (Text with EEA relevance) http://data.europa.eu/eli/reg/2019/2088/oj2 Regulation (EU) 2020/852 of the European Parliament and of the Council of 18 June 2020 on the establishment of a framework to facilitate sustainable investment, and amending Regulation (EU) 2019/2088 (Text with EEA relevance). http://data.europa.eu/eli/reg/2020/852/oj3 Directive 2014/95/EU of the European Parliament and of the Council of 22 October 2014 amending Directive 2013/34/EU as regards disclosure of non-financial and diversity information by certain large undertakings and groups Text with EEA relevance. http://data.europa.eu/eli/dir/2014/95/oj4 Terminology used by Bank of England: “Discussion Paper, The 2021 biennial exploratory scenario on the financial risks from climate change, December 2019”.5 right. based on science (2020). Capturing the ˚Climate Factor. Linking Financial Performance and Temperature Alignment through the X-Degree Compatibility Model. All opinions expressed are those of the author. investESG.eu is an independent and neutral platform dedicated to generating debate around ESG investing topics.
 > zoom image Share price development Solactive Europe 600 Index divided into six share selections according to XDC gap. Source: right. based on science (2020) Capturing the °Climate Factor. Linking Temperature Alignment and Financial Performance through the X-Degree Compatibility (XDC) Model.[/caption] Separate back-tests conducted for each of these stock selections revealed only slight differences in performance in the middle ranges. The four "outer" selections, however, showed considerable differences: The stronger the 2˚C-Alignment, the better the results in terms of return, volatility, maximum drawdown, resilience, Sharpe and Sortino ratio. Within the period under review, the selection of the "Most Aligned" stocks had yielded a 107% higher total return compared to the "Least Aligned" selection, with volatility aligned with the overall volatility of the Europe 600 (16.6%).The risk-adjusted returns also support these results. As the historical "underwater equity curve" shows, the "Most Aligned" selection proved to be more resilient overall compared to the "Least Aligned" subgroup. The maximum drawdown of -30. 6% (tail risk; extreme losses) for the "Most Aligned" selection is significantly smaller than that of the "Least Aligned" subgroup with -42. 6%.[caption id="attachment_4859" align="aligncenter" width="685"]
 > zoom image | Underwater Equity Curve of the 'Most Aligned' and 'Least Aligned' stock selection of the Solactive Europe 600 Index in comparison. Source: right. based on science (2020) Capturing the °Climate Factor. Linking Temperature Alignment and Financial Performance through the X-Degree Compatibility (XDC) Model.[/caption] As the XDC Model benchmarks each security against a sector-specific target, that is to say, a Paris-aligned temperature target that is specific to the sector, sector-bias within the stock selections could be avoided. No significant over- or underweighting of sectors was noticeable across the sub-groups.[caption id="attachment_4862" align="aligncenter" width="943"]
 > zoom image | Sector distribution of the 'Most Aligned' and 'Least Aligned' stock selection of the Solactive Europe 600 Index in comparison. Source: right. based on science (2020) Capturing the °Climate Factor. Linking Temperature Alignment and Financial Performance through the X-Degree Compatibility (XDC) Model.[/caption] Temperature Alignment: Benefits for Asset ManagersAlthough the analysis presented is limited in terms of observation period, asset class and region, it provides first indications that temperature alignment metrics such as the XDC Model can bring significant benefits for use in asset management.A solid temperature alignment analysis provides concrete and transparent information on the inside-out materiality perspective, which can also serve as a uniform, unifying and - above all - science-based 'language' for investors, companies, regulators, politicians, and society. To manage a successful transition into a future ‘well below 2˚C’, decision-makers need a strong narrative, which promotes the ability to act instead of paralysing through complexity. When it comes to climate change, there can hardly be a clearer and stronger narrative than temperature. | brief bioDr. Sebastian Müller, LL.M., is co-founder, in-house lawyer and head of law & regulation at right. based on science. After his doctorate in tax law, he worked for several years for the international law firm CMS Hasche Sigle in Frankfurt. At right. he is responsible for the legal foundation of the XDC Model and the cooperation with financial market actors. aboutright. based on science GmbH (right.) is a provider of climate metrics and software. Founded in Frankfurt in 2016, right. developed the X-Degree Compatibility (XDC) Model to calculate the impact a company, a portfolio or any other economic entity has on global warming (Temperature Alignment). The results are expressed as a tangible degree Celsius value Endnotes
1 Regulation (EU) 2019/2088 of the European Parliament and of the Council of 27 November 2019 on sustainability‐related disclosures in the financial services sector (Text with EEA relevance) http://data.europa.eu/eli/reg/2019/2088/oj2 Regulation (EU) 2020/852 of the European Parliament and of the Council of 18 June 2020 on the establishment of a framework to facilitate sustainable investment, and amending Regulation (EU) 2019/2088 (Text with EEA relevance). http://data.europa.eu/eli/reg/2020/852/oj3 Directive 2014/95/EU of the European Parliament and of the Council of 22 October 2014 amending Directive 2013/34/EU as regards disclosure of non-financial and diversity information by certain large undertakings and groups Text with EEA relevance. http://data.europa.eu/eli/dir/2014/95/oj4 Terminology used by Bank of England: “Discussion Paper, The 2021 biennial exploratory scenario on the financial risks from climate change, December 2019”.5 right. based on science (2020). Capturing the ˚Climate Factor. Linking Financial Performance and Temperature Alignment through the X-Degree Compatibility Model. All opinions expressed are those of the author. investESG.eu is an independent and neutral platform dedicated to generating debate around ESG investing topics.
Published by
 investESG
 investESG

